


The fast rise of drone use in the civilian sector has been based on their success as easy-to-use carriers of RGB cameras first of all. A relatively simple drone with a non-expensive visible light spectrum camera can solve a surprisingly wide range of tasks – mapping, inspections, surveillance, video recording. At the next wave, new camera sensors were added to the portfolio of available tools – IR (infra-red), multispectral, and hyperspectral cameras (while the latest are still quite exotic because of their extremely high price).
Compact LIDARs suitable for medium UAVs (with a take-off weight of less than 25kg) have been available quite long ago, but their high price was the stopper for wide adoption in the industry despite their capabilities. But just a few years ago, DJI exploded the airborne (drone) LIDAR market with their L1 sensors. The price for pretty capable LIDAR sensors dropped dramatically – from more than hundreds of thousands of USD to less than 10K. Starting from that moment, LIDAR became a widespread sensor to collect surface data using UAV.
Cameras of different kinds plus LIDARs today may cover 99% of drone applications in civilian sectors (if we exclude entertainment – drone light shows, and still not exists in practical scales drone delivery). The remaining 1% may look exotic, but it is fascinating as it covers capabilities to survey what is underground/underwater or detect invisible things.
The experience of SPH Engineering’s Integrated Systems division, operating within this niche but intriguing and highly profitable market, indicates that aside from cameras and LIDARs, the most commonly used sensors are:
– Magnetometers
– GPR (ground penetrating radars)
– Methane detectors
– Echo sounders
Turning the attention to the specifics of sensor technology, it’s critical to explore the key sensors that have a major role in advancing this field. Let’s proceed with a detailed review of the listed items.
Magnetometers
Initially, airborne magnetometers were employed during World War II to hunt German submarines. After the war ended, progress in sensitivity, precision, and application workflows allowed to use of airborne magnetometers in civilian sectors, first of all for minerals exploration and geophysical studies. The rise of drone use and availability of light and compact sensors added new applications for these sensors – hi-resolution surveys for archaeology, utility detection, and UXO (unexploded ordnance) search.
With the ability of drones to fly at extremely low altitudes, especially if the drone is equipped with the true terrain following system, magnetometers are able to detect relatively small ferrous items underground.
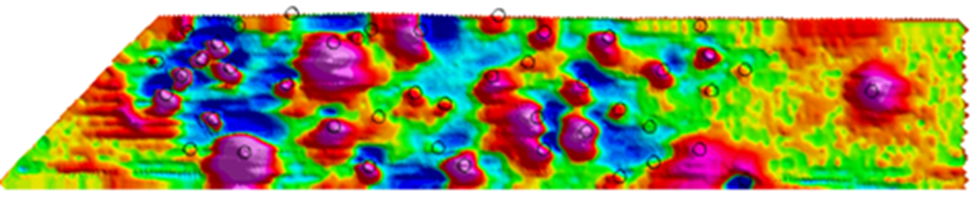
The standard product of a magnetic survey is magnetic anomalies map + its interpretation, for example, in the form of a list of anomalies with their coordinates. The detection principle is based on the fact that in close proximity to ferrous items magnetic field will be slightly different from the ambient field. These “spots” or anomalies allow identifying the possible point of interest.
A typical question regarding magnetometers is, “What range has your sensor”. The answer is zero. ZERO. The magnetometer measures the magnetic field at the point where the sensor is. The probability of detecting some particular ferrous target depends on many factors, where the distance between the target and sensor is the most important – as an anomaly from the target is decreased as 3rd power of the distance.
My favorite joke about detection using a magnetometer is that an atomic submarine at a distance of 500m creates the same magnetic anomaly as a nail at 10cm – and that’s more or less true! So, if the purpose of a magnetic survey is to detect something small – low flight altitude is the key to success. In the case of minerals exploration, flight altitude can be higher – normally, it is 30…50m, at least above trees.
Ground penetrating radars
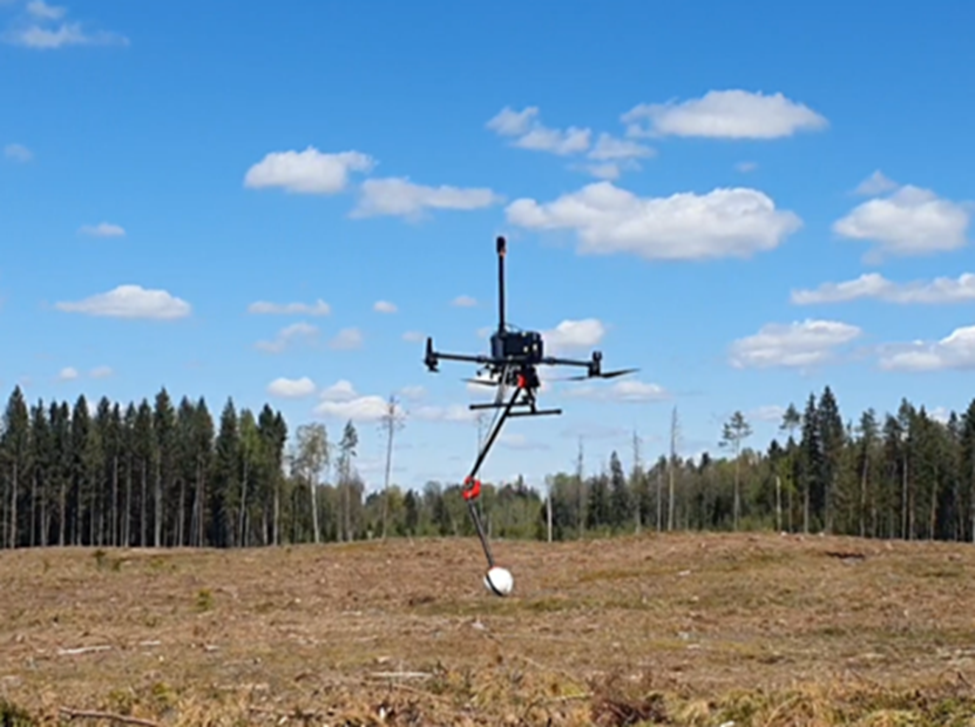
In opposition to magnetometers, ground penetrating radars (or GPR) are active sensors. They emit electromagnetic (EM) impulses and digitize signals received by the receiver antenna. EM wave reflects from the margin between two mediums that have different dielectric permittivity, a parameter that defines the speed of EM wave in that material. That allows to detect different layers of soil, objects, etc. GPR is also a pretty old technology, but a wide spread of their use on drones started just recently when lite and compact GPR systems became available on the market.
Typical applications for GPR (including airborne) are shallow soil layers (strata) profiling, detection of underground objects and utilities, archaeology, and scientific and environmental studies. The main limiting factor for GPR is soil/medium conductivity. For example, in clay/clayed soil, GPR may be absolutely useless as clay, with its high conductivity blocks propagation of EM waves to the target and back. The most favorable mediums for GPR are ice and snow (here the depth of penetration may be a few hundred of meters for drone systems), dry soils with low content of clay and without high-conductive contamination with fertilizers, etc.
Unfortunately, there are no “universal” GPR systems, as the maximum penetration depends on the frequency of emitted EM waves. Lower frequency means deeper penetration (but on the cost of resolution). Below are some examples of GPR system frequencies and their typical penetration in good soil conditions as well as the minimum size of detectable objects:
| Center frequency, MHz | 1000 | 500 | 300 | 150 | 100 |
| Penetration from the surface, m | 0.5 … 1 | 2 … 4 | 4 … 8 | 8 … 15 | 15 … 20 |
| Penetration from the drone, m | 0.3 … 0.5 | 1 … 2 | 2 … 4 | 4 … 8 | 7 … 10 |
| Penetration from the drone in freshwater, m (Water conductivity <200 µS/cm) | – | 0.5 | 2 | 4 | 7 |
| Recommended maximum distance between the antenna and the surface for airborne survey, m | 0.3 (practical limit is 0.6m) | 0.6 | 1.0 | 2.0 | 3.0 |
| Minimum size of detectable objects under surface from the recommended altitude, cm | 7 | 10 | 20 | 35 | 50 |
Typical desire of many customers is to detect something underground flying over high vegetation/trees. Unfortunately, that’s not possible – the density of the energy of EM impulse from the GPR antenna decreases as the second power of the distance, power of the received signal reflected from some anomaly decreases as 4th power of the distance. That’s in ideal conditions in vacuum. The vertical and horizontal resolution of GPR system decreases proportionally to the distance.
It is a shame that some not responsible sellers and manufacturers of GPR systems support myths that by using their system, it is possible to detect, say, utilities or landmines/UXO flying over forests. The only medium where penetration will not degrade dramatically with an increase of antenna elevation above the surface is ice or snow. In all other types of surfaces minimum distance between the antenna and the surface is a key for reasonable subsurface penetration.
Typical results of GPR surveys are so-called 2D profiles as well as horizontal slices. Below is an example of the 2D slice, and the reader can notice that the shape of anomalies recorded using GPR doesn’t reflect the shape of underground objects. There are different techniques in GPR data processing that allows to “convert” anomaly representation into something closer to the real shape of an underground object (a process called migration), but GPR data requires processing and interpretation by a trained specialist.
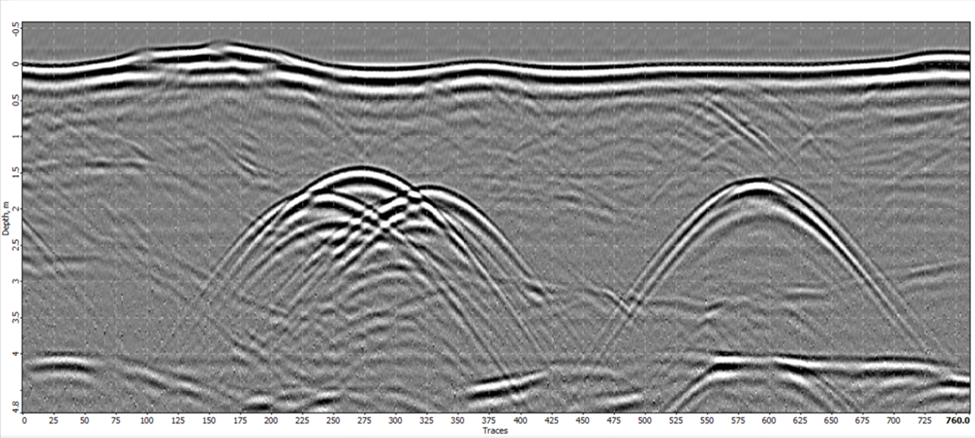
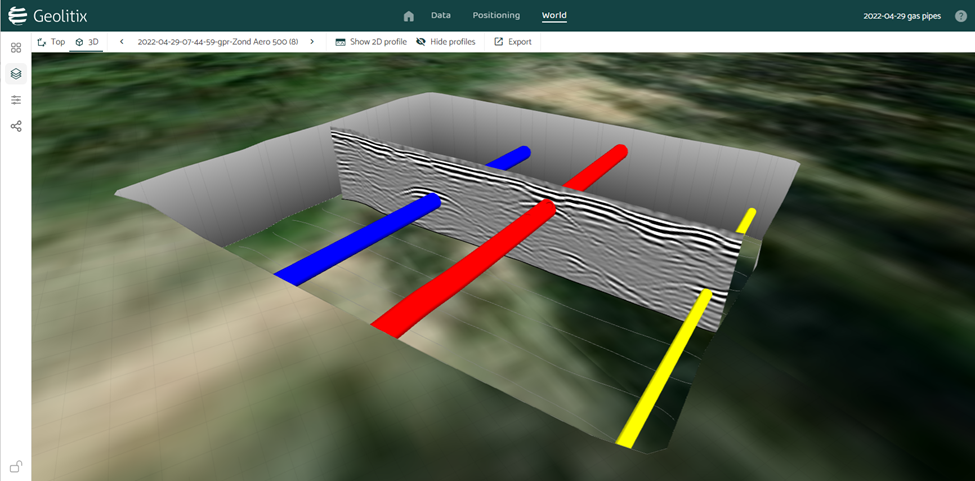
As end-users of the GPR data in most cases are not GPR experts, they usually will receive reports based on GPR data interpretation – 2D horizontal slices, file with the centerline of underground utility with estimated depth, or even 3D model.
Methane detectors
Detecting methane leaks is important for several reasons, primarily due to its significant impact on the environment, human health, and safety. Methane is a potent greenhouse gas, and its release into the atmosphere contributes to climate change. Here are some reasons why detecting methane leaks is crucial:
Climate Change: Methane is a potent greenhouse gas, with a much higher global warming potential than carbon dioxide over a 20-year period. When released into the atmosphere, it traps heat, contributing to global warming and climate change. Reducing methane emissions can help mitigate the rate of climate change.
Air Quality and Health: Methane leaks are often accompanied by the release of other harmful pollutants, such as volatile organic compounds (VOCs). These pollutants can degrade air quality, leading to respiratory problems and other health issues for both humans and animals.
Energy Efficiency and Conservation: Methane is the primary component of natural gas, a valuable energy resource. Detecting and repairing leaks in the natural gas supply chain can help conserve energy and prevent economic losses for both producers and consumers.
Economic Impact: Methane leaks represent a significant economic loss for natural gas companies and other industries. Detecting and fixing leaks can save money and improve operational efficiency.
Fire and Explosion Hazards: Methane is highly flammable, and the accumulation of leaked gas can create fire and explosion hazards, posing risks to both property and human life.
Regulatory Compliance: Many regions have regulations and emission reduction targets to limit methane emissions. Detecting and addressing leaks is necessary for companies to comply with these environmental regulations.
Environmental Responsibility: In an era where environmental concerns are increasingly important, detecting and preventing methane leaks demonstrates a commitment to environmental responsibility and sustainability.
Agricultural Impacts: Methane emissions from sources like landfills and livestock farming can also be significant. Detecting and managing these leaks can help minimize their impact on the environment and reduce agricultural emissions.
Long-term Sustainability: As the world transitions towards renewable and cleaner energy sources, detecting methane leaks helps ensure that natural gas, if still used, is extracted and transported with minimal environmental impact.
Overall, detecting methane leaks is essential for reducing greenhouse gas emissions, mitigating climate change, protecting human health, and promoting a more sustainable and environmentally responsible future.
Standard methods of methane leak detection are stationary installed and portable (handheld) detectors. Methane sensors on the drones bring the possibility to detect leaks in areas not equipped with permanent sensors and not reachable by humans with detectors in their hands.
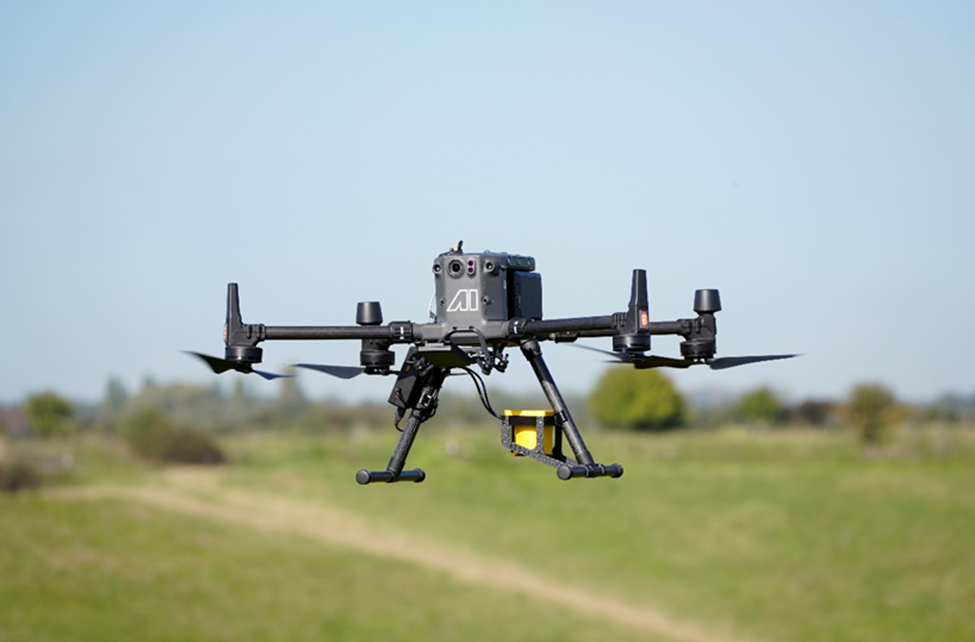
Currently, the most popular sensors are based on the principle of infrared absorption spectroscopy. The laser emits light, which reflects and is captured by the sensor. The outgoing and incoming signals are compared with the built-in reference cell. If methane is present along the laser path, the laser light is partially absorbed. An algorithm calculates the gas concentration in parts per million multiplied by a meter. In simple words, – the device measures how many methane molecules per meter of a laser beam.
The benefits of the method are obvious – methane leaks can be detected from some [safe] distance (30m practical range for the Laser Falcon sensor), and the drone can be sent to hard-to-reach areas or cover large areas in a limited time. The drawback is that sensor can’t measure the volumetric concentration of methane, it allows to detect presence of methane and make comparisons (“in point A there is much more methane than in point B”) only.
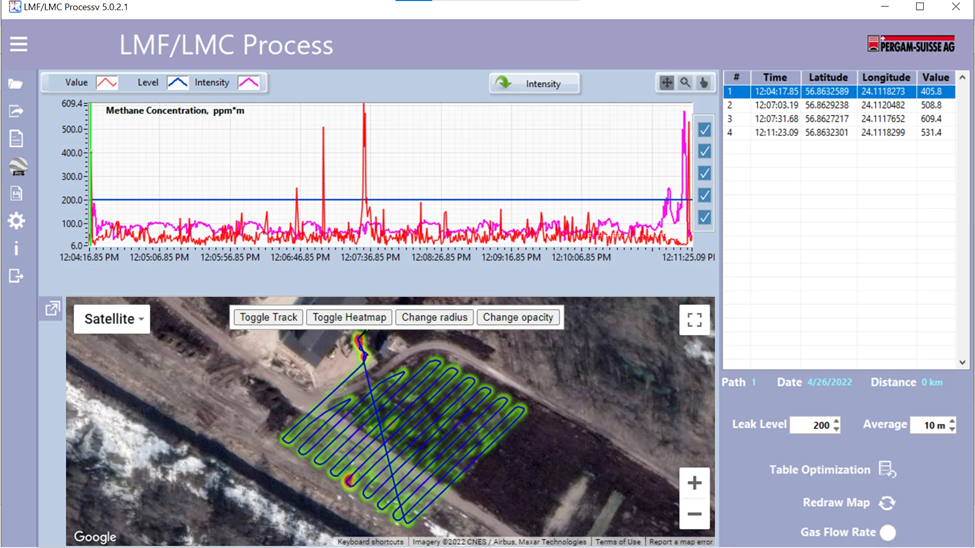
Processing methane detector data is usually pretty simple and straightforward and, in most cases, takes just a couple of minutes. The results of processing are a heatmap and file with coordinates and sensor measurements for points where the detected amount of methane molecules is above some set threshold.
Echo sounders
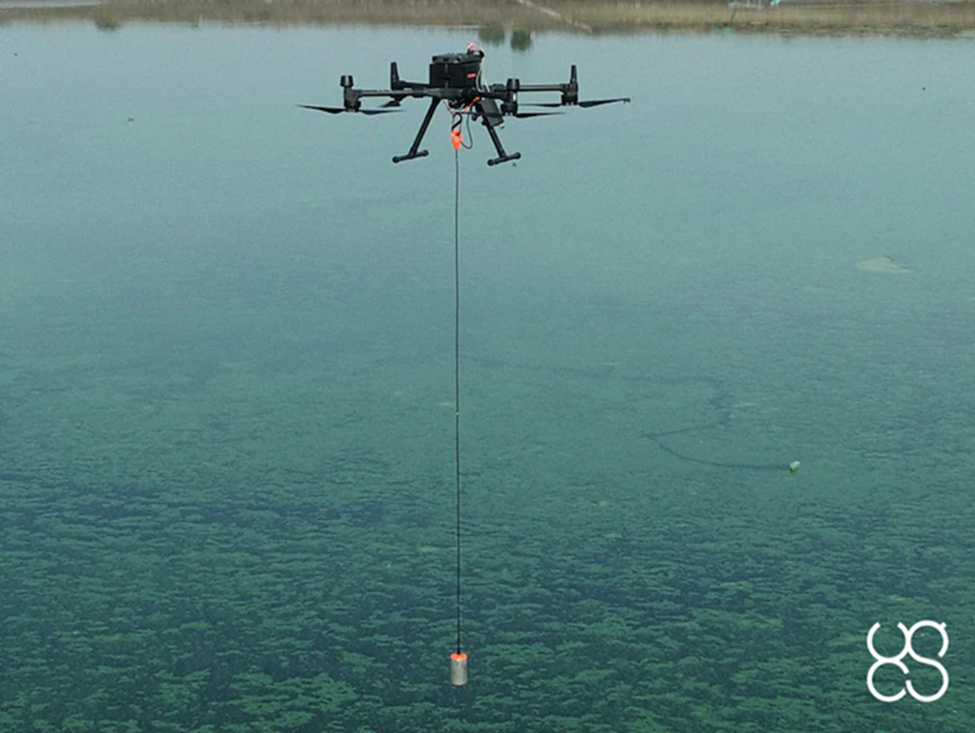
Echo sounders are the sensors to measure the depth or, more precisely, the distance between the sensor and the bottom (or some obstacle for the sound wave). That is a very old technology. Interestingly, the first deployed devices utilizing echo sounding technology were used to detect German submarines in WWI. Echo sounders to measure depth were invented in the 1920s. Now they are installed on all ships and many small boats/yachts.
Besides navigation tasks (on ships), echo sounders are widely used for bathymetry – measuring or profiling the bottom of water bodies. Applications are countless – before any construction work of anything which is at least partly in the water (pier, bridge, …), dredging planning and monitoring, environmental studies, flood prediction, and environmental studies. Dual-frequency echo sounders also allow measuring the thickness of sediments, further expanding possible applications of technology.
Traditional methods of bathymetry (using an echo sounder on the boat – manned or unmanned) or even sending the guy with a measurement pole to the water – will exist forever, but drones can fill the gap between capabilities of other methods, for example, in dangerous conditions or when there is no physical access to the water (or liquid – as echo sounders work in any liquid).
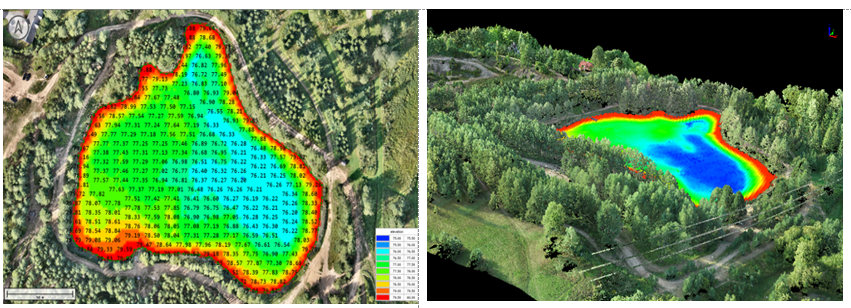
Results of bathymetric surveys, in most cases, are elevation profiles of the bottom or depth maps. Bathymetric data can be exported as XYZ files as well, allowing to combine data for underwater parts of surveyed areas with, for example, LIDAR data.
There is one more method for bathymetric surveys available on the market – using green LIDAR technology. That method has great benefits – first of all, unmatched performance of surveys and the capability to scan underwater and surface in a single pass. But these sensors are still not very popular for two reasons – quite high price and limited penetration in turbid water, making them almost useless for inland water bodies. But in coastal areas, when water is clear, these sensors provide a good price-to-performance ratio.
How does that all work??
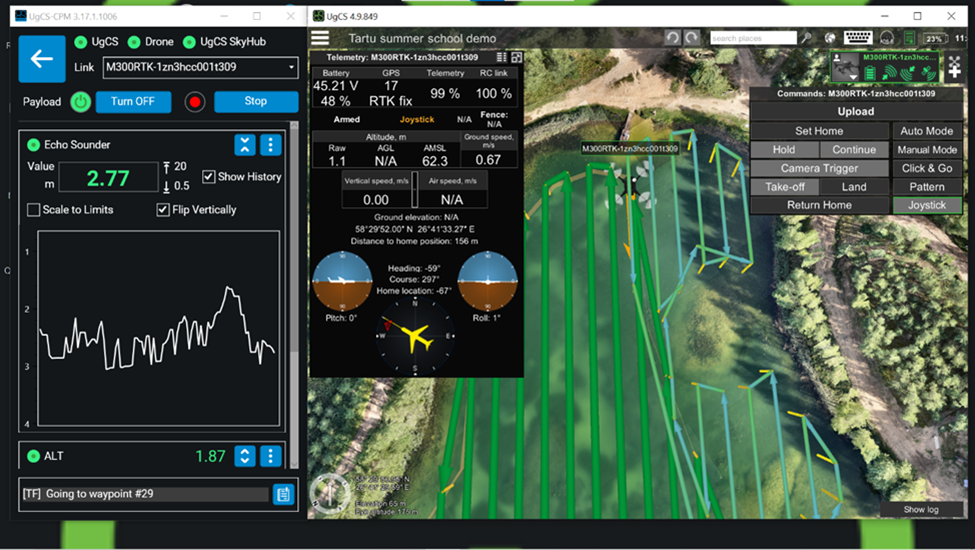
All drone operators (or almost all) know how to conduct photogrammetry missions. They should plan the mission in appropriate software, providing necessary parameters defining the quality of output materials: the size of the pixel on the ground, overlapping, etc. Flight planning software will do the rest of the magic, and the drone operator should upload route to the drone and activate an auto mission. The drone will fly a pre-planned route, making photos in points calculated by planning software. After the flight, it is necessary to download photos from a drone or camera and process them in appropriate software, making output artifacts like orthophoto maps, elevation models, etc.
With the sensors discussed above, things work almost the same way – route planning, uploading the mission, flying in auto mode, downloading the data, processing, and interpretation. For the sensors, which are fully integrated with drone and control software, an operator can see the sensor’s readings during the flight.
What’s next?
The sensors discussed above are the most popular, but more and more sensor types are integrated with drones every year. I may name gamma radiation sensors, different gas sniffers/analyzers, water samplers, and EMI tools.
Here at SPH Engineering, we are following on demands of potential customers and currently working on a few new sensor groups:
– We would introduce gamma radiation sensors in our portfolio
– Researching the problem of carrying active (EMI) metal detector on the drone to provide the capability to detect small metallic items from the drone
– Finishing the integration of surface velocity doppler radar – sensor to measure water flow speed.
The drone industry wants to cover more and more applications, so that’s expected that existing sensors will be adapted for airborne use in parallel with the development of application workflows, so we will see a lot of exciting solutions coming to the market.
Bio
Alexey Dobrovolskiy is Chief Technical Officer, Member of The Board, and Co-Founder at SPH Engineering, a multiproduct drone software company and UAV integration services provider. Since founding SPH Engineering in 2013, he has introduced several solutions that are recognized globally like software to manage drone shows and drone-based industrial product lines. Currently, Alexey is responsible for strategy management and development and liaises with a few main customers. He also spends a lot of time in the field, testing SPH’s solutions in real-life scenarios.
Before founding SPH Engineering, Alexey had gained 20+ years of experience in the software industry. He graduated from one of the leading tech universities in Eastern Europe and started his career as a software developer. Later, he acted as a senior project manager and team lead: the largest team led by Alexey consisted of 450 specialists (analysts, software developers, Q&A experts, and consultants). The main focus was on custom software development for multiple industries (financial, insurance, logistics, manufacturing, etc.), while the project scale varied from tens to tens of thousands of users.


