


GNSS signals are the backbone of modern airborne navigation — but with the growing risks of jamming and spoofing, relying on GNSS alone is no longer safe. The key question across the navigation industry is no longer how well a system performs with RTK or in harsh urban environments, but rather: how far can you fly — and how accurately — when GNSS is unavailable?
Answering that question requires far more than a single test. It demands repeated, controlled, and statistically meaningful evaluations.
Providing a performance test report of an Inertial Navigation System (INS) in GNSS-denied conditions isn’t about producing a nice-looking plot or a single impressive number, often expressed in “percentage of the travelled distance”. It’s about demonstrating real performance in real scenarios — the same conditions our customers face in field. That’s why, at SBG Systems, we chose to build a qualification-style airborne Dead Reckoning report rather than a simple “cherry-picked” demo.
The results presented in our report are based on a short yet meaningful statistical dataset. We analyzed multiple outages and derived statistics to provide a representative picture of true performance. A best-case result might occur once out of three trials — or once out of ten thousand. Publishing only that result would be just misleading.
This short article explains why this approach matters and what you should look for when interpreting a GNSS-denied test report. The goal is to help you make informed decisions when selecting the right solution for your application.
Why not show just one GNSS outage like everyone else
In reality, UAV navigation in GNSS denied with airdata aiding is not a simple matter. The environnements conditions are very important to account for.
Some reasons why relaying on one ideal outage is a misleading picture:
Stable airflow = best case: When airflow around the aircraft is stable, the dynamic environment is smooth, and the INS behaves better. But that doesn’t reflect all missions.
No vibration = best case: Vibrations degrade inertial sensor stability and bias estimation. A low vibration flight or a well damped system is much easier.
Loops and turns naturally hide heading drift: Turns compensate heading drift and artificially improve position error. It also makes the numbers look great. Impressive, sure… but straight-flight performance is still unknown. Accelerations and rotations help estimate biases. In straight line mission, the INS has a harder job – but that s exactly where performance matters for many customers and that is what makes the difference between INS.
Temperature matters – a lot: Temperature changes modify sensor biases, scale factors, and noise characteristics. In controlled or constant temperature conditions, the INS operates in its comfort zone, giving an overly optimistic view. But real missions involve: rapid temperature transitions (take-off to altitude), cold, thin air at high altitude, hot environments near engines.
What do you get when all conditions are met ?
When all the stars finally align — perfectly damped vibrations, smooth airflow, steady temperature — the INS delivers its very best. The kind of performance that makes engineers scratch their heads wondering how to do it again… and makes our customers grin from ear to ear: Ellipse, with its industrial-grade IMU, behaves like a tactical-grade INS, drifting only 0.56% of the distance traveled — about 30 m over 5 km. Ekinox Micro raises the bar, trimming drift to 0.13% DT, around 7.2 m. And Apogee? Barely moving 2 m over the same 5 km.

How to interpret a GNSS-denied test report ?
When evaluating dead reckoning performance don’t start with the final error numbers, start with the trajectory.
Here is a guided 6-step breakdown for you to follow:
1 – Check the trajectory first
The geometry of the flight defines whether the test is challenging or artificially easy. Many “marketing tests” use: short loops, racetrack pattern or repeated turn-around segments. These trajectories compensate inertial errors and make performance look unrealistically good.
2 – Check the number of outages
A single outage is one sample. It might look great – or terrible – just by chance.
3 – Look at the outage duration, and not only the travelled distance and the speed
A report that only shows 10–20 second outages tells you nothing about how the INS behaves during a longer GNSS outage.
4 – Examine how the error is reported
Some specifications present only an average error, which can be misleading and not truly representative of real-world performance. More meaningful evaluations typically focus on the end-of-outage error, which reflects the actual drift accumulated during a GNSS outage or denied environment. It is also important to verify whether the error is expressed per axis and whether it uses RMS or another statistical measure. Ideally, the full error evolution over time should be provided, giving a complete view of how the system behaves throughout the entire outage period rather than relying on a single summarized value.
5 – Look for environnemental conditions (rarely mentioned, but crucial)
INS performance is sensitive to real-life disturbances: vibrations, temperature gradients, airflow distortions and varying magnetic conditions (for magnetometer-assisted systems).
6 – Check the INS error curve shape. It should exhibit a linear or exponential growth — not a sinusoidal behavior.
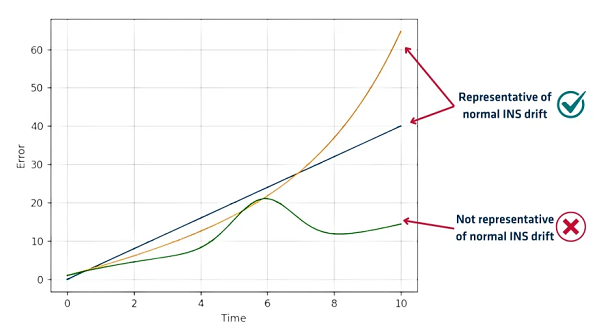
The yellow and blue curves are representative of normal INS drift when the platform is moving in a straight line without GNSS. The error increases steadily over time, either linearly or exponentially, which is expected. On the contrary, the green curve (shape) is not representative of typical INS drift. An error that grows at first (linear or exponential), then forms a “bump” and starts decreasing indicates that the trajectory is not straight.
This pattern reveals that a turn or change of direction occurred, which causes the error to partially cancel out instead of increasing monotonically.
Source: SBG Systems


