


1. Anti-interference technology introduction
Low-power Anti-interference technology is ComNav patented advanced anti-narrowband and anti-continuous-wave interference technology. The SNR can reach 60dB and the power consumption is only 0.1W when enabled.
LAI technology can quickly detect and mitigate interference through simple setup to ensure the safety of equipment during operation.
In latest firmware version, K8-series have added advanced interference detection and suppression features, which can detect and suppress radio interference sources. At the same time, we added a technology that can output interference source spectrum data, which can be used to detect interference types and possible interference sources.
- 2. Spectrum function in MyPort Software
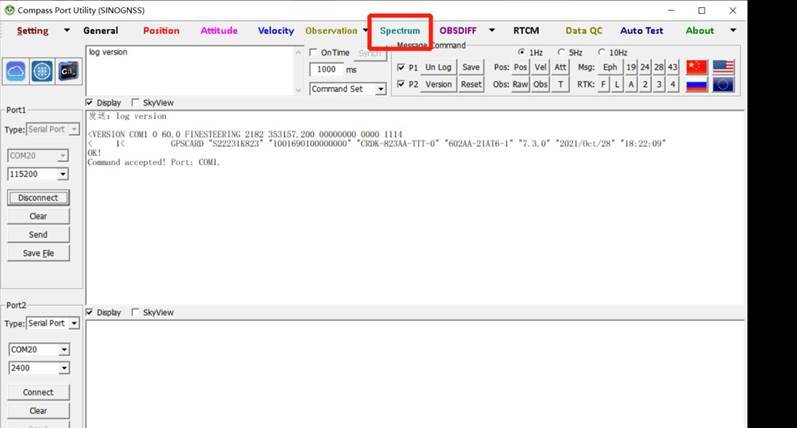
Clients can use ComNav MyPort software for detect and mitigate interference.
Open MyPort, select Spectrum in the software, check the scan frequency and scan range, and adjust the scan frequency manually.
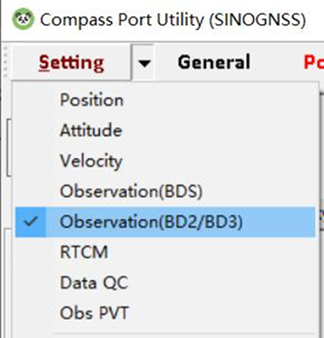
And select “Observation (BD2/BD3)” in Setting.
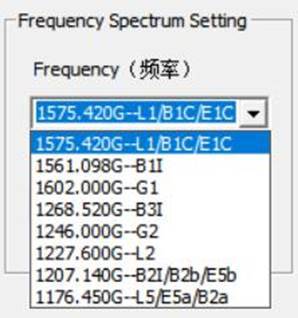
You can set the scanning Frequency and Range in Frequency Spectrum Setting.
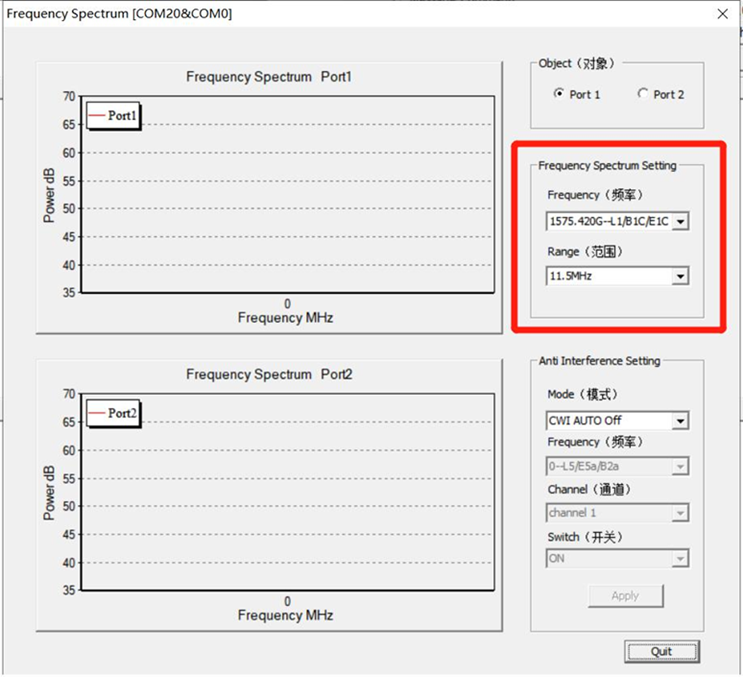 |  |   |
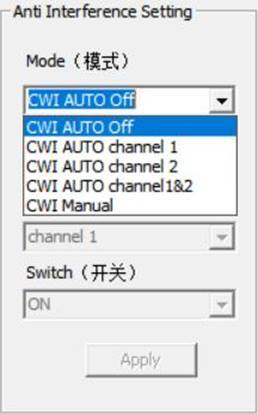
For setting anti-interference, you can select the mode as you needed.
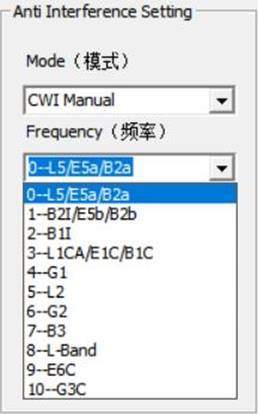
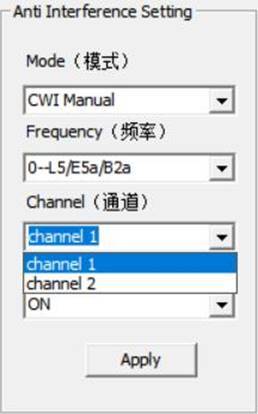
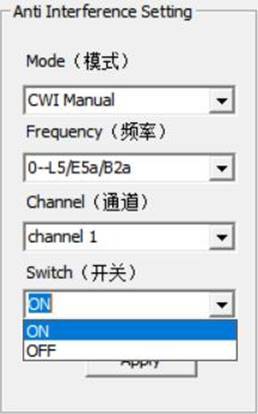
When ‘CWI Manual’ is not selected, frequency, channel and switch are not selectable; When‘CWI Manual’ is selected, you can manually configure the frequency, channel, and switch.
 |  |
 |  |  |
- 3. Example
Here is an example show the whole steps.
The test jamming frequency is on GPS L1. 60 dBm interference was added at 1.57542GHz using an RF signal generator as interference.
The device is connected as shown in the figure below. The satellite signal and the interference signal provided by the RF signal generator are sent to the module to be tested by the confluence. The signal-to-noise ratio and positioning status are concerned.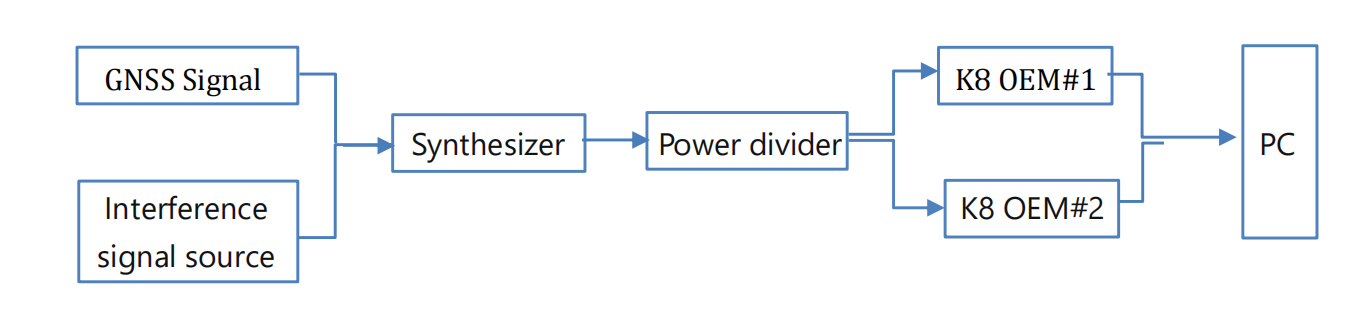
Note: The default scan number is 200.
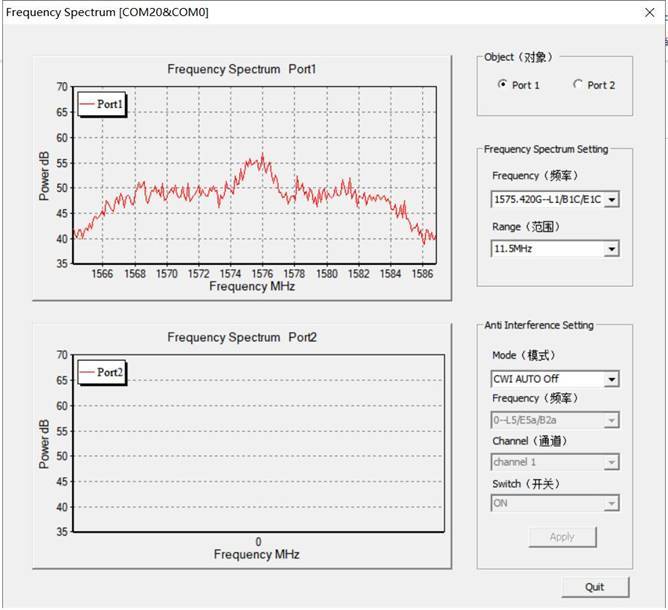
(1) Spectrum diagram when only GNSS signal is connected.
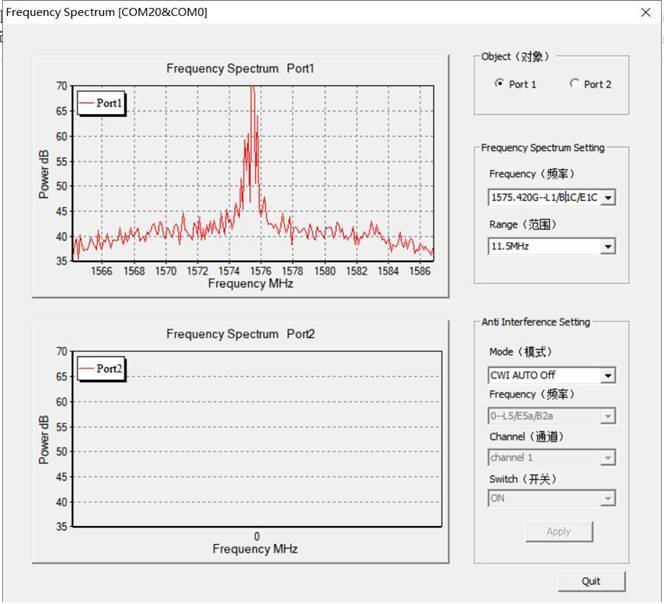
(2) Spectrum diagram of adding interference signal source.
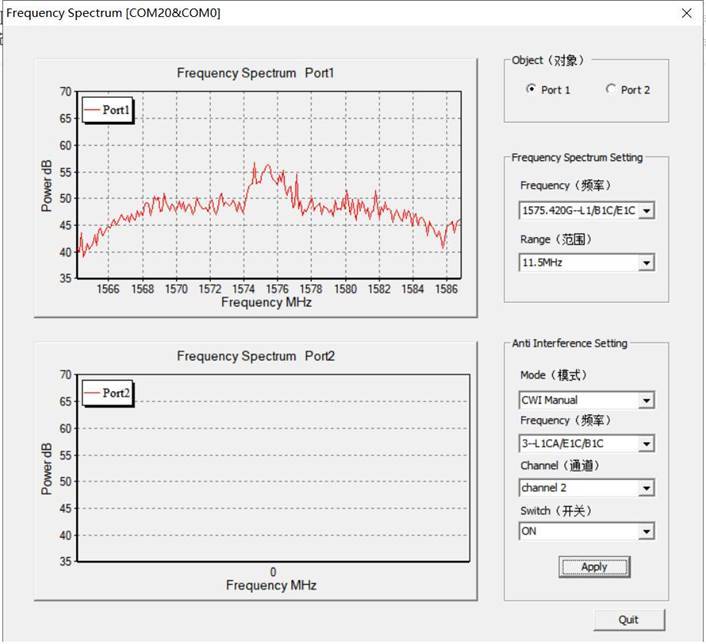
(3) Spectrum diagram after activing anti-interference
- 4. Data Analyze
If the user needs data further analysis, the data can be decoded by Binary_MsgDecode tool. A column of data can be obtained by decoding, and the data can be imported into EXCEL for plotting. The horizontal coordinate is the scanning frequency, which can be obtained according to the scanning frequency and scanning range of the central point set by the user. The ordinate is the interference intensity, which can be obtained by the formula dBm=20log(A). (A is the scan value)
- 4.1 Commands introduction
Command format 1:
SCANSPECTRUM <center-freq> <scan-range> <scan-times>
Command format 2:
SCANSPECTRUM <mode>
Descriptions:
This command is used to set spectrum scanning parameters
Parameter:
center-freq: Set the scanning center frequency, unit: KHz
scan-range: Set the scanning range, unit: KHz
scan-times: Set the number or the scan points
mode: L1/L2/L5, according to the center frequency of L1, L2, L5 frequency points, the scanning range is 8000KHz, 200 points scanning.
Example:
SCANSPECTRUM 1575420 8000 200
Message:
The message is the function of spectrum scanning.
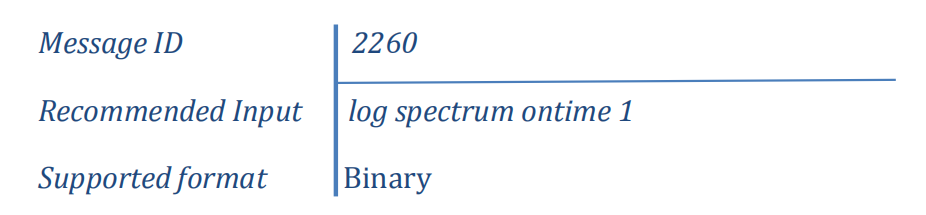 Message Strcture:
| Field#StructureDescriptionTypeByteByte offset1HeaderMessage header H02CentFreqThe center frequency of the scanning, unit: KHzint4H3ScanRangeScanning range, unit: KHzint4H+44ScanTimesNumber of points (N) to be scanned, 200 points at mostint4H+85ScanStartThe initial frequency of the scanning, unit: KHzint4H+126ScanSampleThe step length of the scanning result, unit: KHzint4H+167ScanRatioN scanning values, N is the number of scanning pointsUshort2*NH+208CRC32-bit CRC checkHex4H+20+2*N |
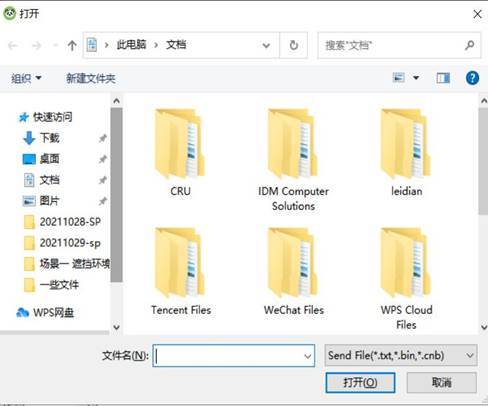
- 4.2 Data playback
‘MyPort’ software supports data playback function. Users can play back the saved data according to their needs. Disconnect the connection, select ‘File Process’, click ‘Connect’, the folder will automatically jump out, users can choose.
 | |  |
- 4.3 Data decode
Open ‘Binary_MsgDecode’ software, drag the file in, click ‘ENTER’, it will auto decode a file named ‘Message2264.log’, client can use it for further analysis.
For more information visit ComNav Technology Blog Here.


